We are now starting to pull the pieces of the data physicalisation together and to think about the data sources, the practicalities of the build and the WOW factor for public engagement. In terms of possibilities, we can make something go around 180 degrees, stop and then return to its starting position. We can make something go round and round continuously. We can create something that goes up and down. And finally we can do back lighting.
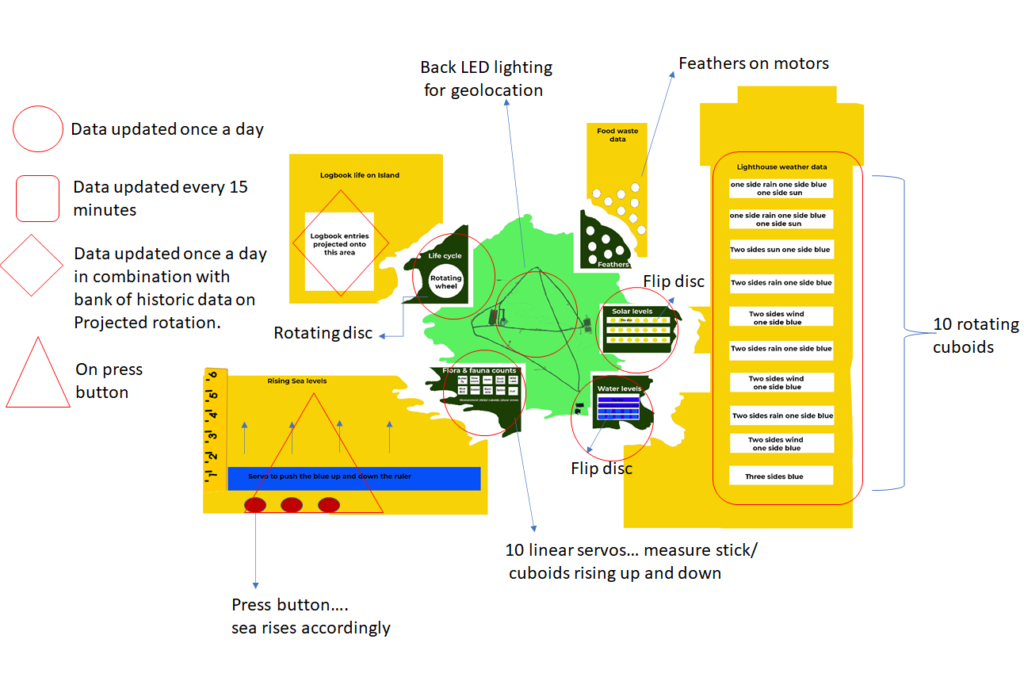
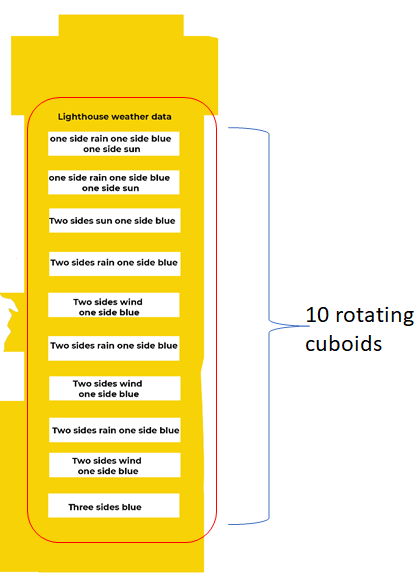
We are envisioning the lighthouse (possibly) with ten rotating cuboids driven by servos. Each cuboid with with a different combination of display.
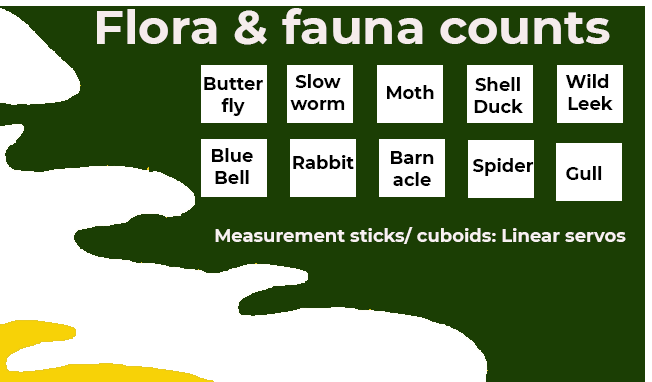
In terms of the flora and fauna count data…. we are currently thinking (this might change) 10 linear servos…. the cuboid in the form of a measure stick pushes out from the island. We are thinking that this possibly happens in a loop as all the count data is collected once a day. For example, the gull count data links up with the geolocation data for the gull as well as links up and triggers the rotating wheel and the feather activity. Each wildlife has a different lifecycle and location data… once the count cuboid is triggered the rotating wheel and location data resets accordingly.
The logbook projections are a combination of that days entry and also a loop of historic entries.
The rising sea level is triggered by the press of a button. Choosing high traffic over a 50 year period could raise the sea levels… this can be visually benchmarked against the ruler/ metric.
The more we don’t recycle the more seagull activity on the mainland (i.e. the more seagulls leave the island)…we are still teasing this out but low seagull numbers on the island could correlate with poor food recycling on the mainland (i.e. more ready food available on the mainland).

0 Comments