A main part of the planning stage of the data physicalisation is the design. This is where we have used various techniques to help us make sense of the narrative problem and how to make an effective data physicalisation (i.e. how to come up with a human centric and effective data physicalisation solution). The following paragraphs will share with you some of the techniques that we used to work out the design. These are techniques that you can also use, these include: Concept Mapping, Sketching, and Storyboarding.
Concept Mapping
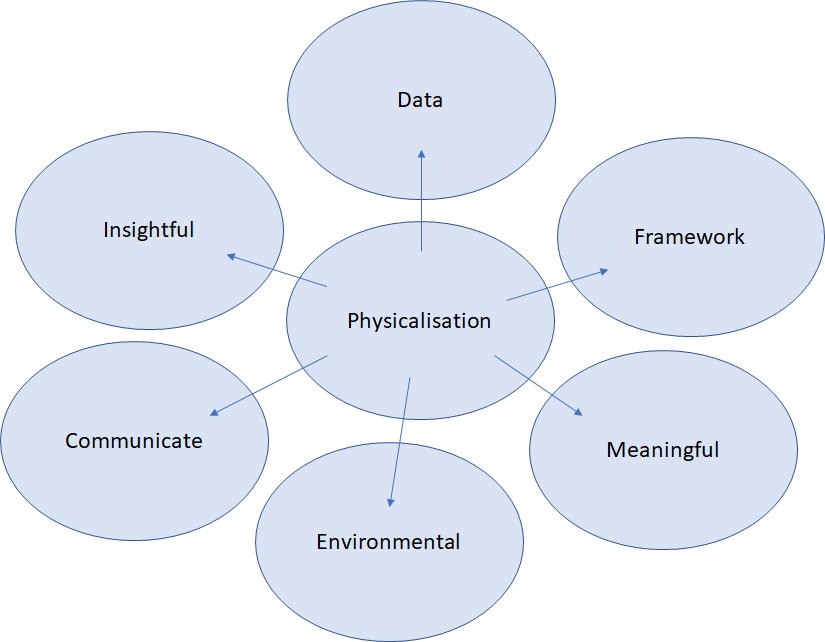
The term concept mapping is typically associated with techniques used to identify relationships between concepts and ideas. Concept mapping is traditionally done through spider diagrams that show individual elements and also may include how those elements interact and work together. For us, concept map 1 enabled us to kick start our thinking, it allowed us to visually summarise all main components of the physicalisation.
From this map, we then proceeded to tease out our ideas further. Concept map 2 highlights how we are starting to think about the data and what sorts of narratives we could create using this data. This concept map shows Flat Holm island and the different flora and fauna that exist upon it, as well as parts of its history and its status as a State of Special Scientific Interest (SSSI). From these initial bubbles came information relative to them, such as the numbers of seagulls or the rising sea levels.
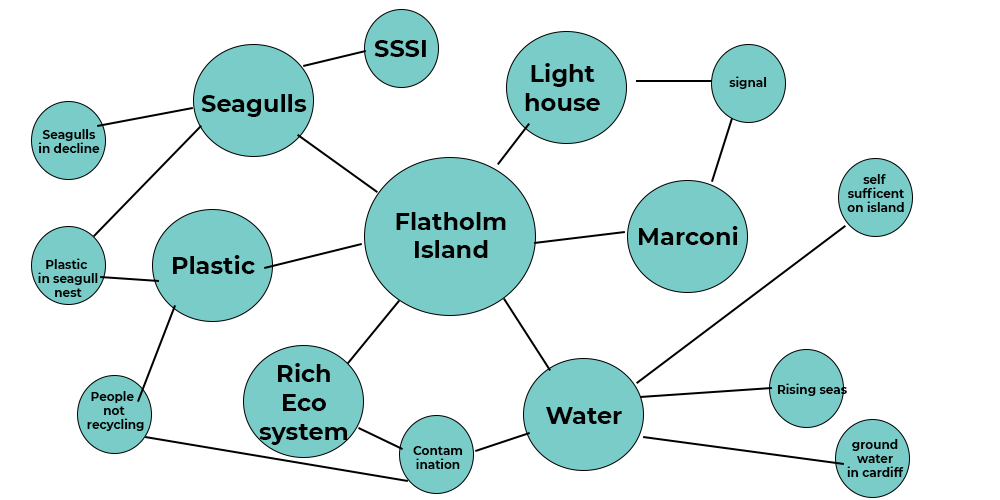
This concept map 2 allowed us to make links between the data entities. The important thing is that you have the space and versatility to zone in on your idea whilst also to build the connections. For us, this was the ecosystem of the island. The concept map enabled us to make the connections and in doing so, think about how we might communicate this narrative to the public in a meaningful way.
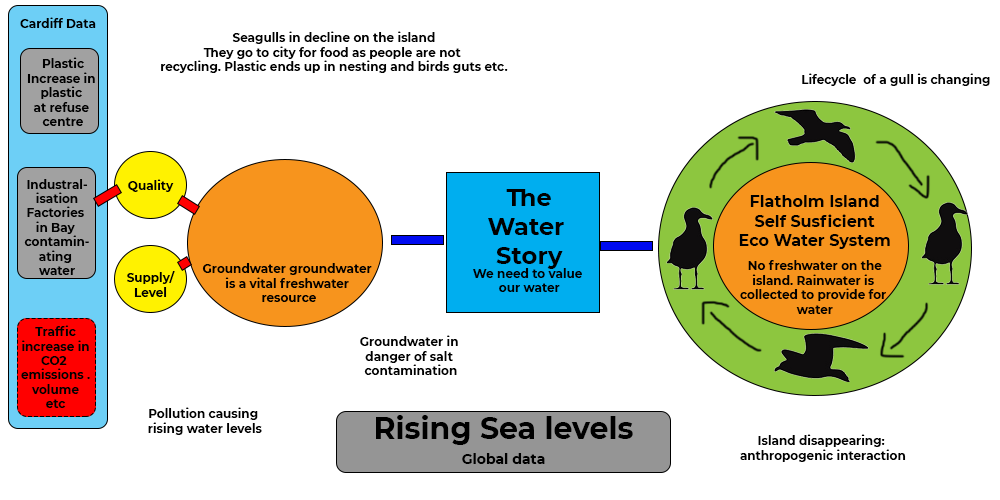
In truth, this technique helped us to really get our heads into the idea. It enabled us to unearth the narrative value of the water story (water— an entity that people generally take for granted). Also, another important narrative aspect of all of this was the warden living on Flat Holm who has to conserve water by not using more than is needed day to day. Each version of the concept maps pushed these ideas further. For example, the next stage (concept map 3) enabled us to see the link between the island and peoples behaviours on the mainland. This could potentially be encoded into the data physicalisation by showing visitors just how important water is to everyday life. What we are demonstrating here is just how valuable this technique has been in the teasing out this information for the data physicalisation.
Sketching
A sketch is typically a rough drawing (on paper, in clay, with card etc.) of a final product used to give a feel for what the product will look like. Sketches are usually coupled with notes to explain in better detail what the designer is thinking and to convey things that can’t be shown through a static image. Whilst designing our data physicalisation, we created numerous sketches representing the various ideas that emerged from the concept maps.
As the Flatholm DAPTEC project is centred on a data physicalisation of Flat Holm island, the lighthouse seemed like a relevant feature to explore as the lighthouse is perhaps one of the most notable landmarks on the island. With the general outline of a lighthouse to work with, we jumped in and played around with presenting the data in whatever way we could think of. As lighthouses are used to signal danger to those travelling at sea, we suggested LED lights or a projector at the top of the structure. The lights could be used to represent conditions such as air quality on the island whilst the projector could show images that were relative to the island such as views of the island itself or flora and fauna (i.e. the native gulls or wild leeks). Lots of ideas emerged from the concepts maps and we found that the sketching technique was the most effective way to capture and expand on these.
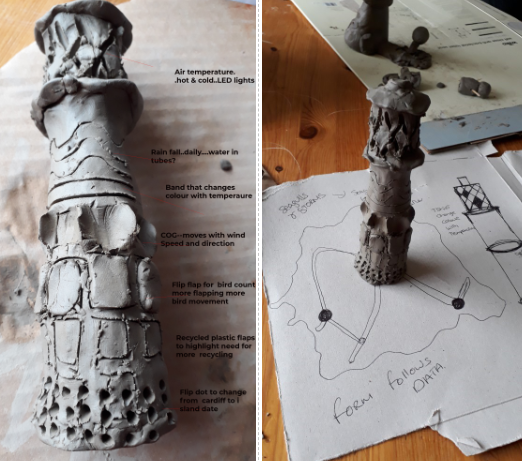
There is no doubt that the final data physicalisation will most probably not look like this early sketch. However, to get to the final data physicalisation, we need to go through these early sketches. The value lies in the sketching process and how it allows you to formulate and consolidate the ideas from the concept mapping activities. For us, this was a very crucial transition.
Storyboarding
Storyboarding has its roots in the film industry, using a series of sketches and notes to explain to the reader how the director envisages the scene to look and how the narrative will be told. With the advent of technology, it has also been adopted into computing, becoming “a common technique in HCI and design for demonstrating system interfaces and contexts of use” (Throng et al., 2006)
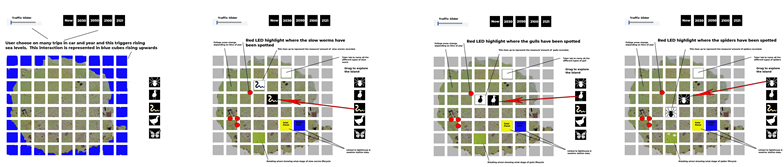
Off the back of concept maps and sketches, the storyboards enabled the breakdown of the data physicalisation experience. For example, what happened when the visitor pressed one of the buttons? How were they transferred into the shoes of the island warden to monitor the wildlife on the island? It allowed us to map the story frame by frame. This technique empowered the storytelling and the bringing to life of the ideas already nurtured and harnessed through the concept maps and sketching activities.