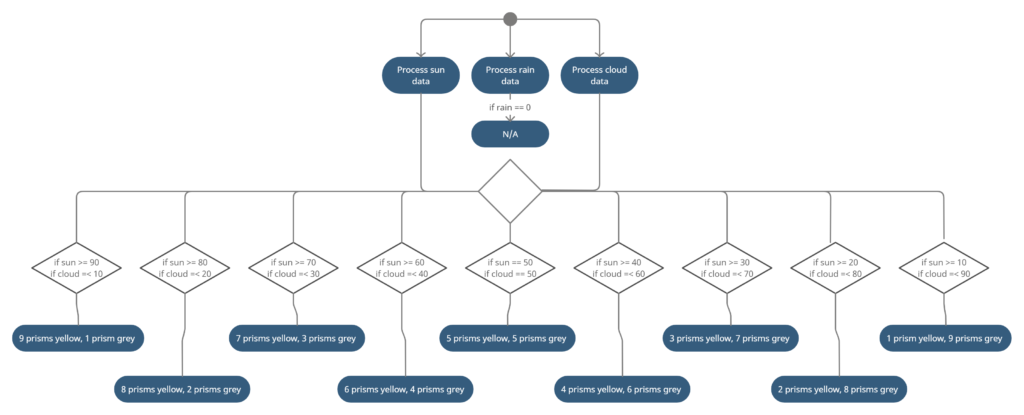
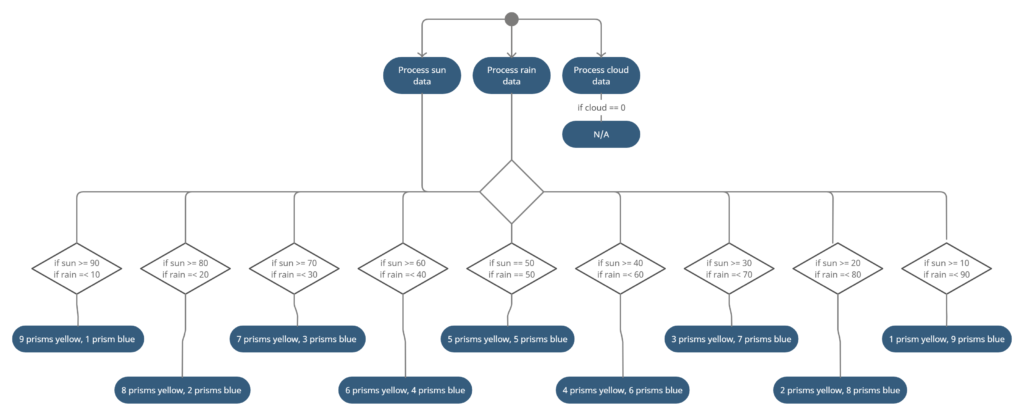
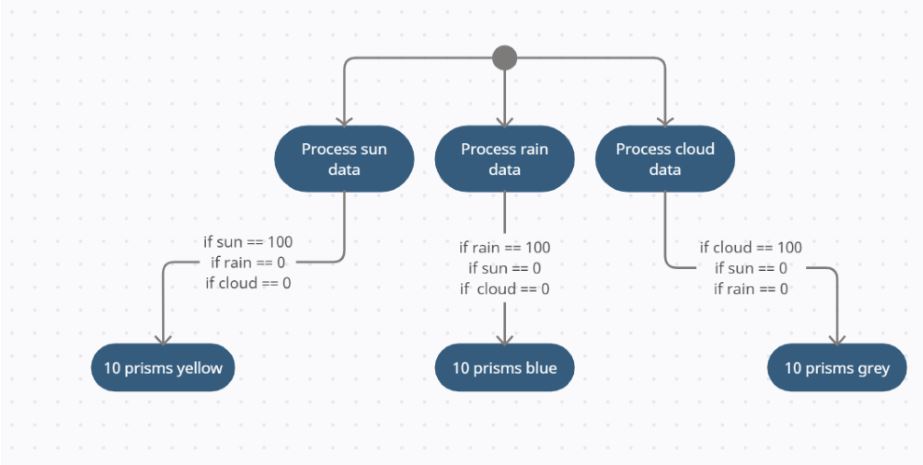
We now have a lighthouse design with ten rotating triangular prisms (i.e. Toblerones) which gives us three rotating sides/ faces to play with (i.e. rain, sun and wind/cloud). We now need to work out what determines all the rain sides to show and visa versa.


Some interesting questions emerging: Are we going to include any additional kinetic components on the light house? We discussed having a weather vane but we also thought that we could have a thermometer and a solar panel with a battery. This will allow us to make use of more data that we have access too – temp for the thermometer, wind direction and speed and the charge being drawn from the solar panel [[Reply: Yes and we could use the light on the top of the lighthouse to represent something. The wind could be captured through one face of the Toblerones (sun, rain, wind) and then the speed and direction presented on the island map (with light movement and the etching)…kind of like the water tank, solar panel etc.]] Looking at the data that will be represented on the lighthouse panels, we came to the conclusion that since it can only update every 15 mins, the lighthouse prisms will actually be fairly static – not much changes in 15 mins and perhaps not at all. [[[Reply: Yes, but we could also look at a looping sequence of Toblerones being triggered every 15 minutes (creating an animation of rain etc.]]].
We are building a prototype based on the actual data to show you what this is likely to look like [[[Reply: Brilliant]]]. We need to transform the data first so the two week gap is perfect for that. We also thought that to make things more interesting we could compress all of the data for the previous week into a thirty second burst on the lighthouse. This would have much more kinetic activity and would be more exciting than looking at something that barely changes. We also wondered if, on update, all the prisms could spin round a bit and settle on the updated data – this would be more interesting kinetically [[[Reply: Brilliant]]].
What is the relationship between the count interactions (etching) and the lighthouse? [[[Reply: The lighthouse is this constant display of weather data…. it’s link to the island is through the water tank, solar panel, weather vane/ turbine etc on the island…. It could also link to the overall look….if it has rained for two weeks….the island might look quite blue/green-ish etc.. At the moment we are thinking USER interaction to show the count data but the lighthouse is independent of the user (i.e. the lighthouse changes with the weather data updates]]]. We mean this in the sense of, when the count data is being presented, what is the lighthouse doing? Is it disabled or dark? Equally, if we were running the compressed weather data, what is happening with the count data? Are there user inputs to control what is being presented?
And more…good thoughts and questions. Briefly –1. yes additional things can be integrated to the lighthouse and the light is definitely something to look at 2. Yes additional kinetic components such as fluttering between updates … the idea of compressing a time period – could be really interesting from the point of view of getting a ‘feel’ for the weather over a period 3. It might be interesting to explore relationships between weather and activity but not sure we have the data..? e.g. when its raining the gulls all huddle in a particular place …etc. water tank / solar panel are clear connections here.


0 Comments