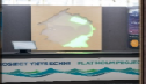
The bigger environmental story is important to us on this project too. We are hoping to pitch an aspect of the physicalisation against the global environmental data picture as a way of highlighting the vulnerabilities of our local environmental picture. Especially the impact that things like transport, agriculture, waste and industrial factories burning fossil fuels are having on the future our Flatholm island. Take a look at some of our thinking below:
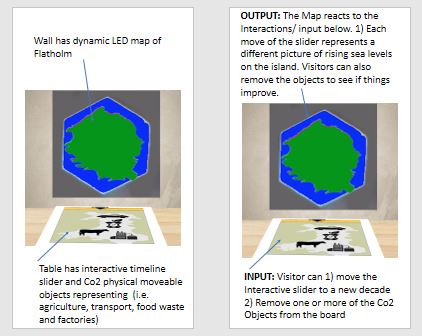
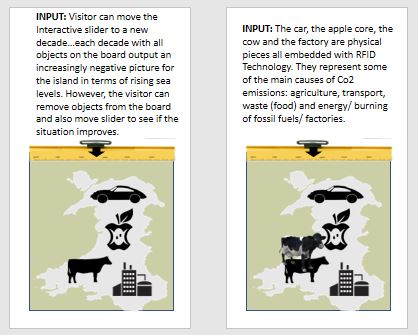
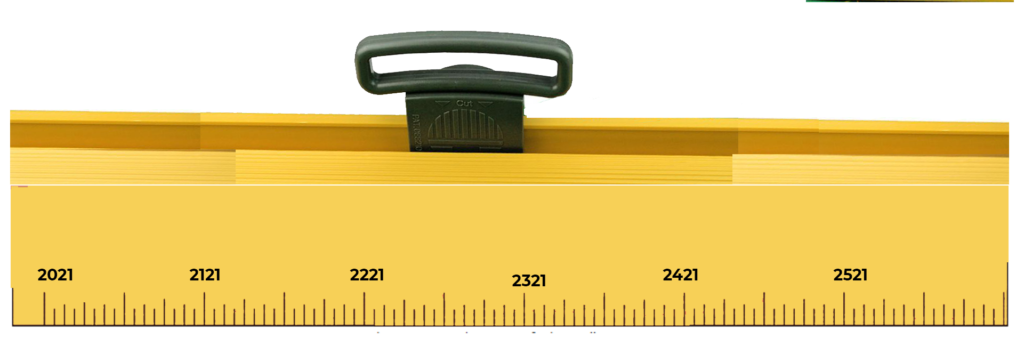
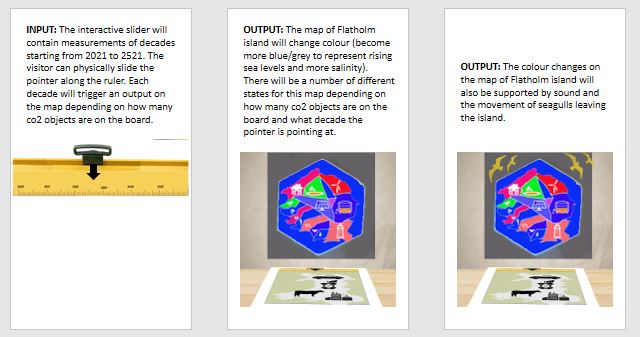
In terms of input/ interaction the user can 1) move the slider timeline 2) remove co2 object from the board. In terms of output, a lighting arrangement, sound and possibly movement of seagulls will be triggered on the map on the wall in response to the input/ interaction. A few questions are emerging around: what timeline points do we need ( we have run in 100s from 2021 to 2521)… should this be smaller (i.e. every 10 or 50 years)? Would it be more interesting if it was smaller? Or is it okay? Also, a question in relation to the local versus global data (i.e. the rising sea levels is a global sea level dataset)— How do we pitch our Co2 objects on the board (i.e. ‘agriculture, transport, factory and waste’)? We are thinking, do these need to be local/ national datasets for each or should we be pitching these globally too?

0 Comments