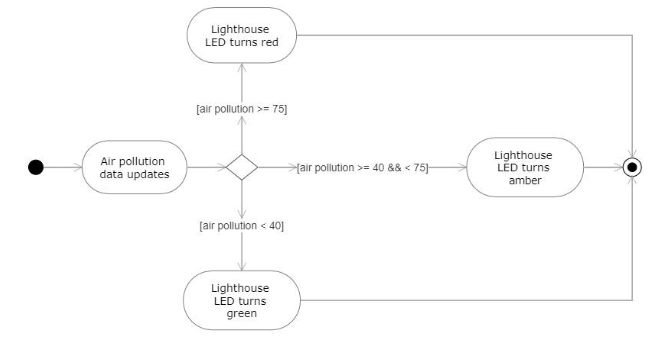
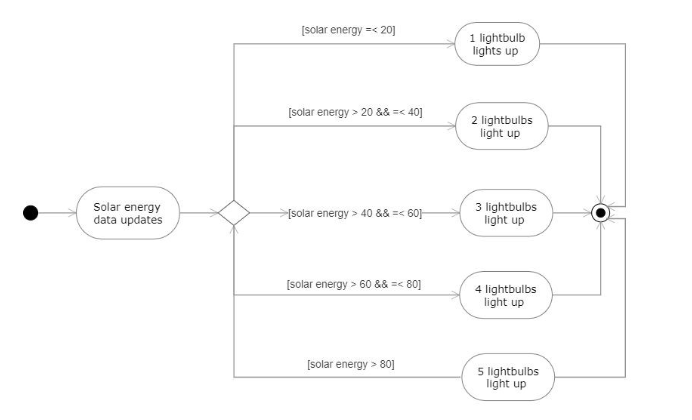
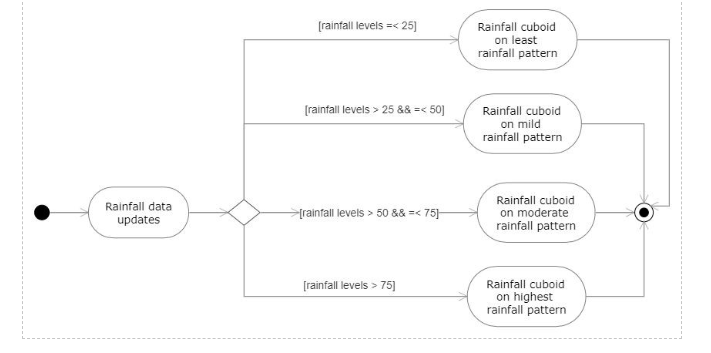
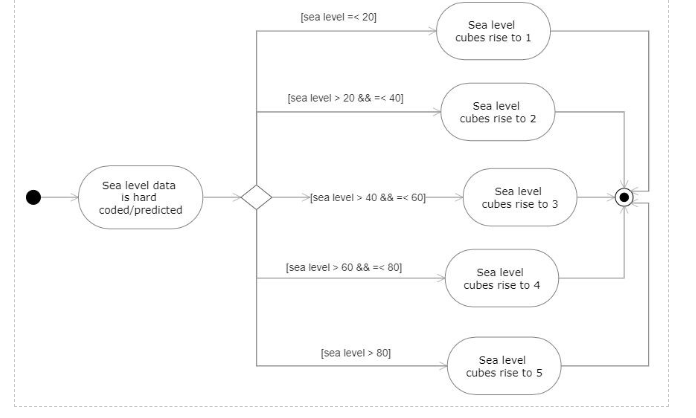
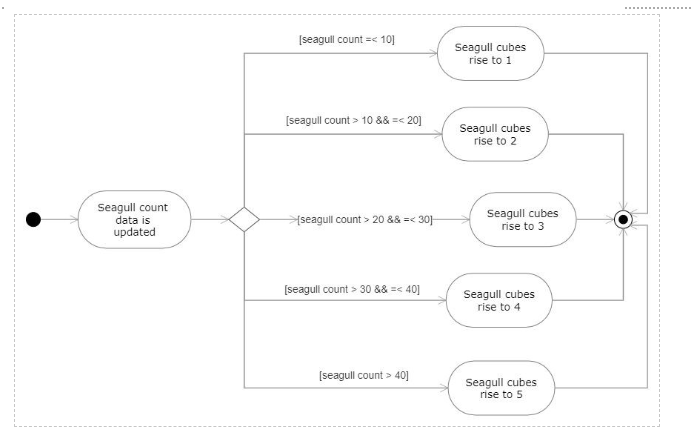
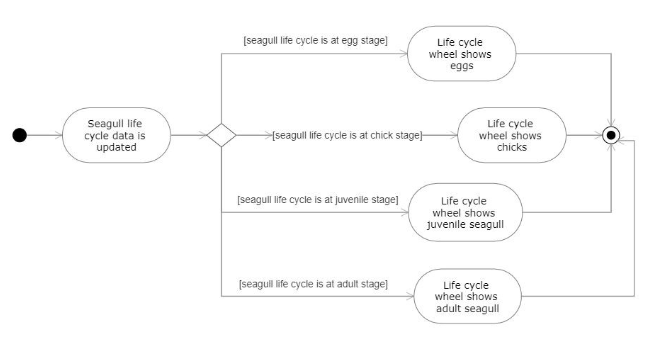
We have started to create some activity diagrams to enable us to delve a little deeper into how the data will impact the data physicalisation. As you will see below the diagrams are very visual, but they can also be used to mimic pseudocode that we can then use to plan out and make sense of the coding for the data physicalisation. These diagrams were created following the DFDs to further make sense of the different elements of the physicalisation and the conditions that are needed to trigger the different actions.


0 Comments