Discussions this week were around how we are going to make this data physicalisation? What do we want to capture with the data? What size will it be? Will it be on the ground or mounted on the wall? After much discussion – particularly around health & safety- we decided to go with the wall. In order to do this we realised that we would need to build this experience in modules. The following sketches are trying to make sense of the different parts of the narrative and how they will fit together.
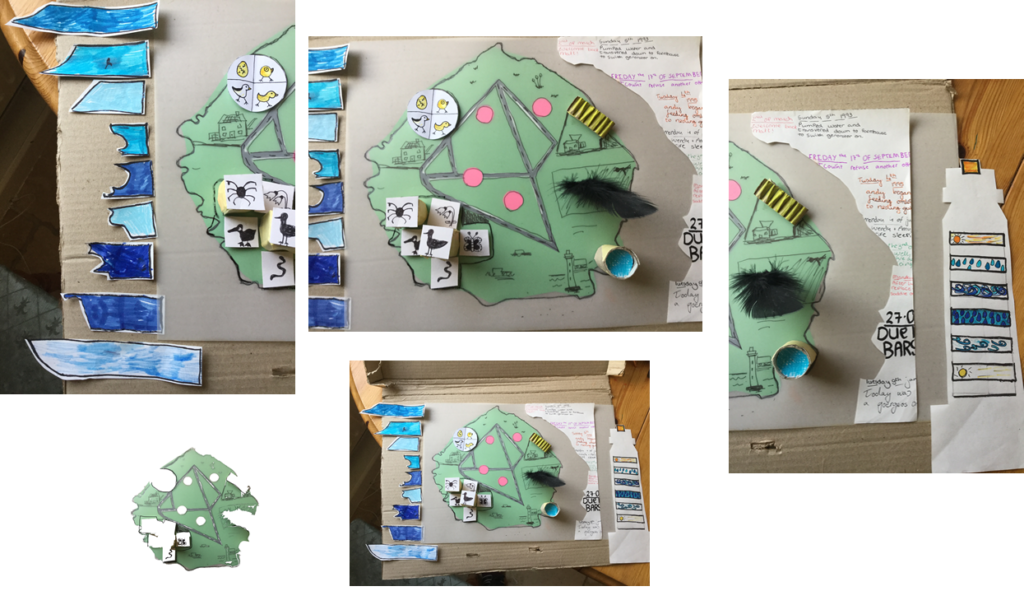
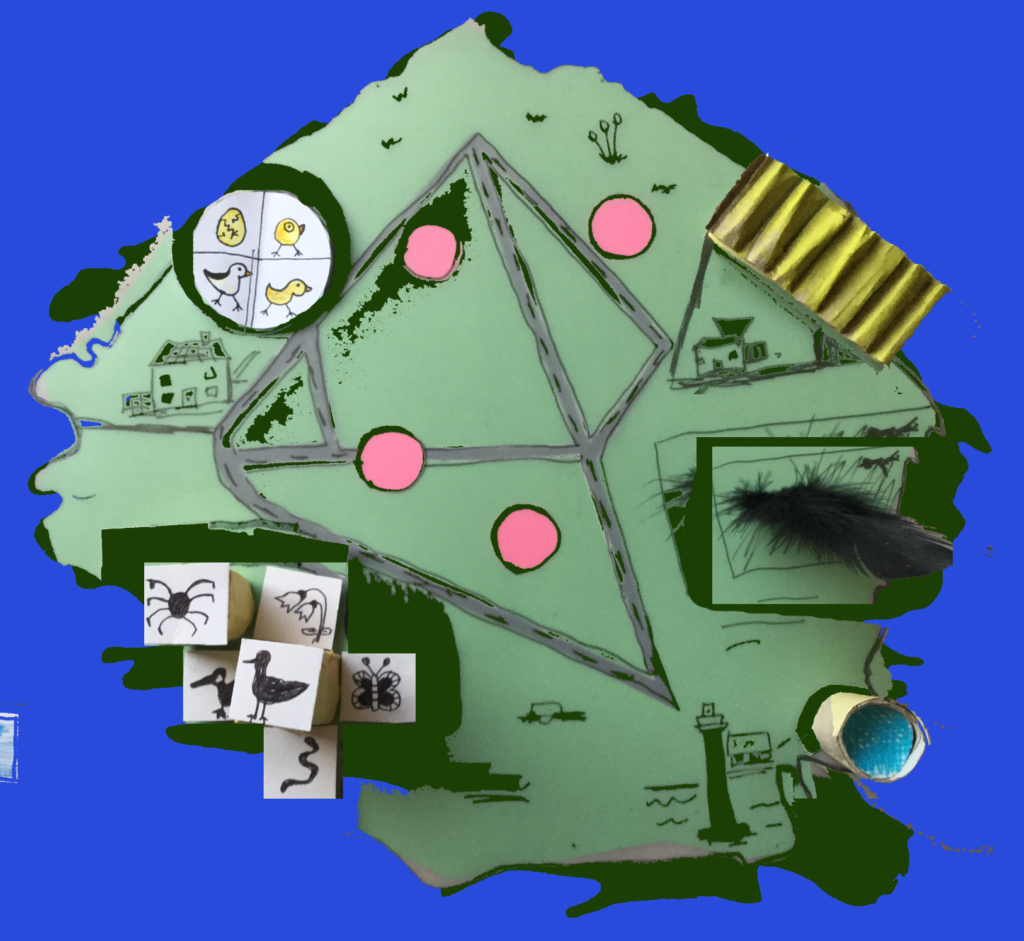
The heart of the data physicalisation…the island could from the main foundation which everything else links to. This island could be lighted from the back to portray the locations of the wildlife but also the different ‘faces’ of the island.
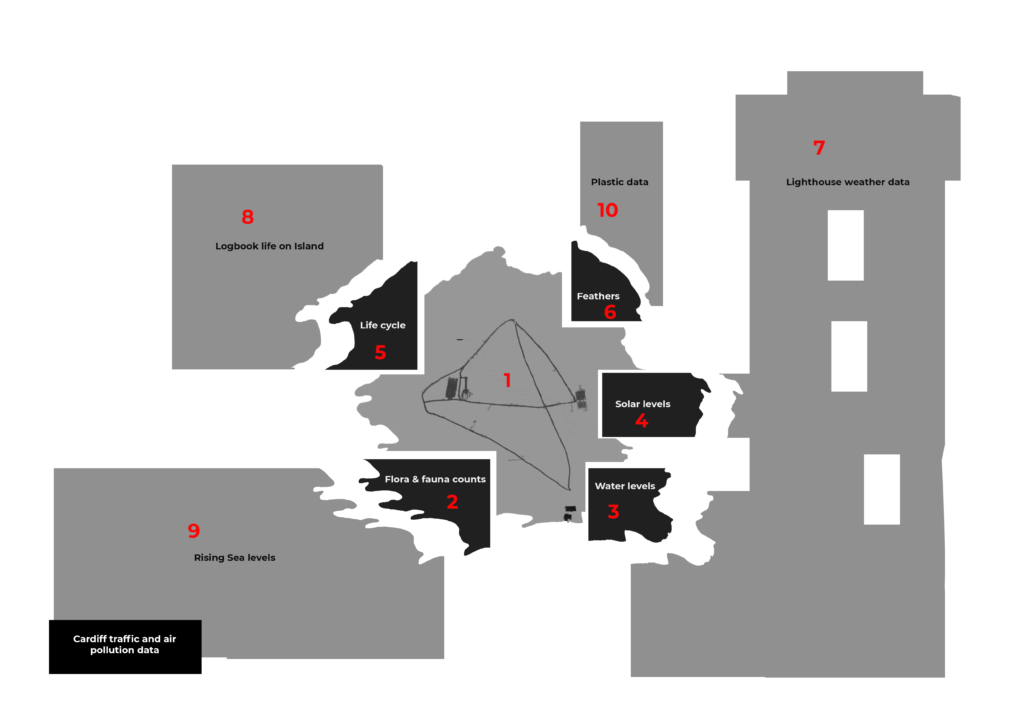
Some of the narrative involves a direct presentation of the data (i.e. flora and fauna data, weather data, water tank and solar panel level data). The rising sea level data involves predictions of global sea level data and local Cardiff traffic and air pollution data.
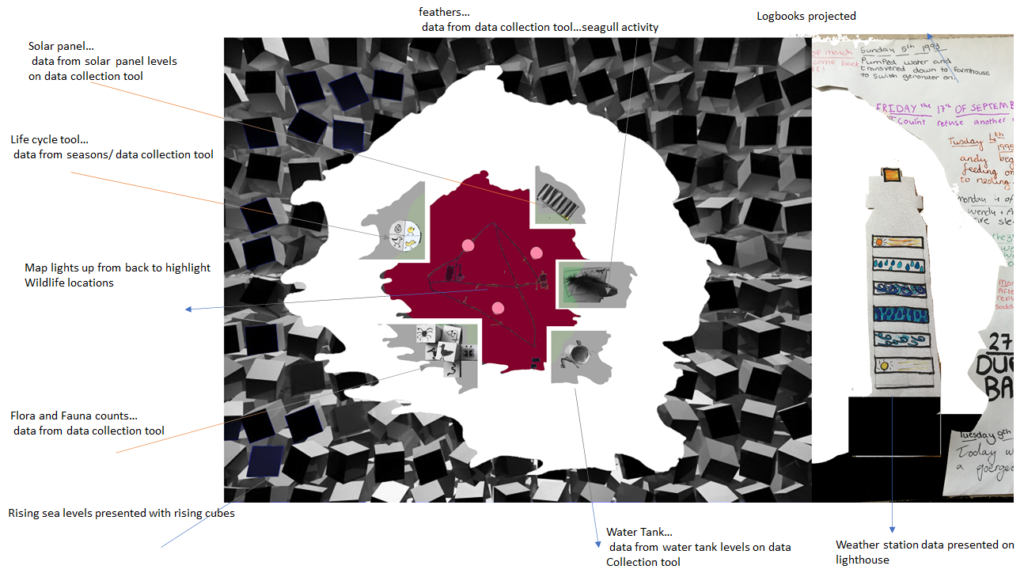
Thinking about how we bring all this together… we started to think of several modules which can be brought together to form a holistic experience.
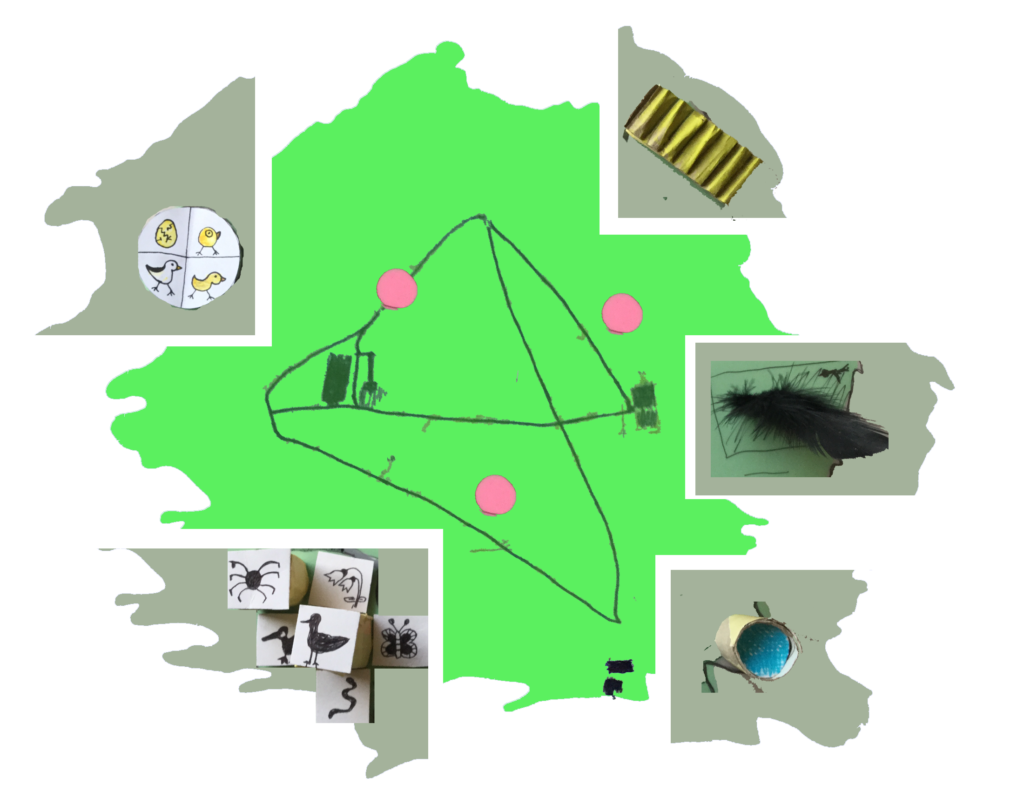
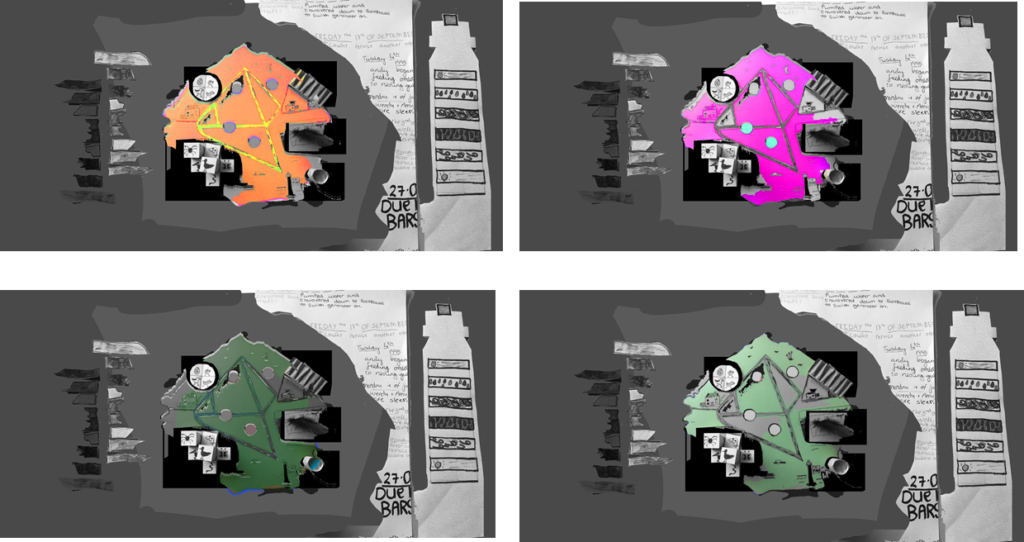
As you can see below the island core can be portrayed in different colours to represent the current ambiance on the island etc.

Pushing this further…how can we link the different parts together….separate yet whole?
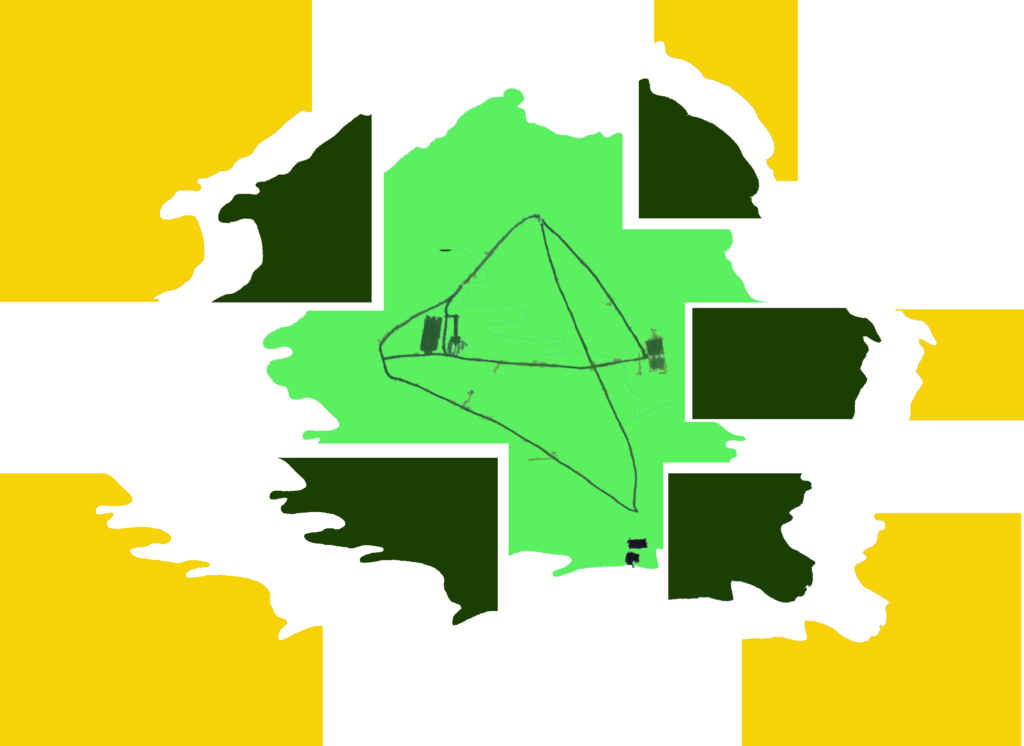
As you can see from the below…we are starting to piece it together through the narrative with the island at the centre…holding it together.
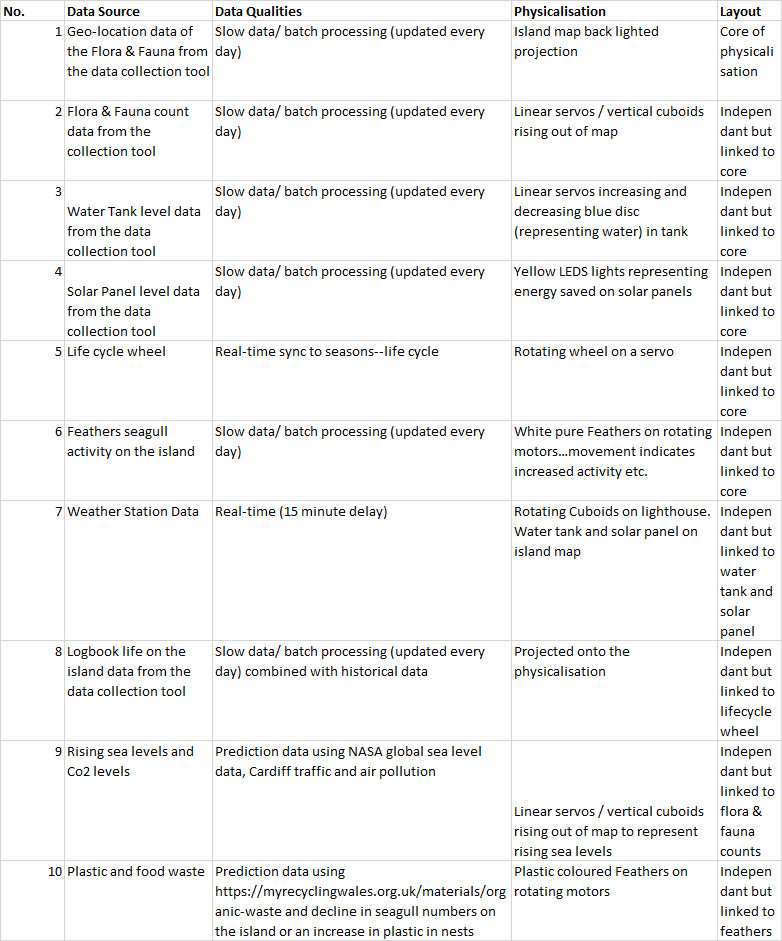
The below information gives more detail on the data source, data qualities and physicalisation.


0 Comments